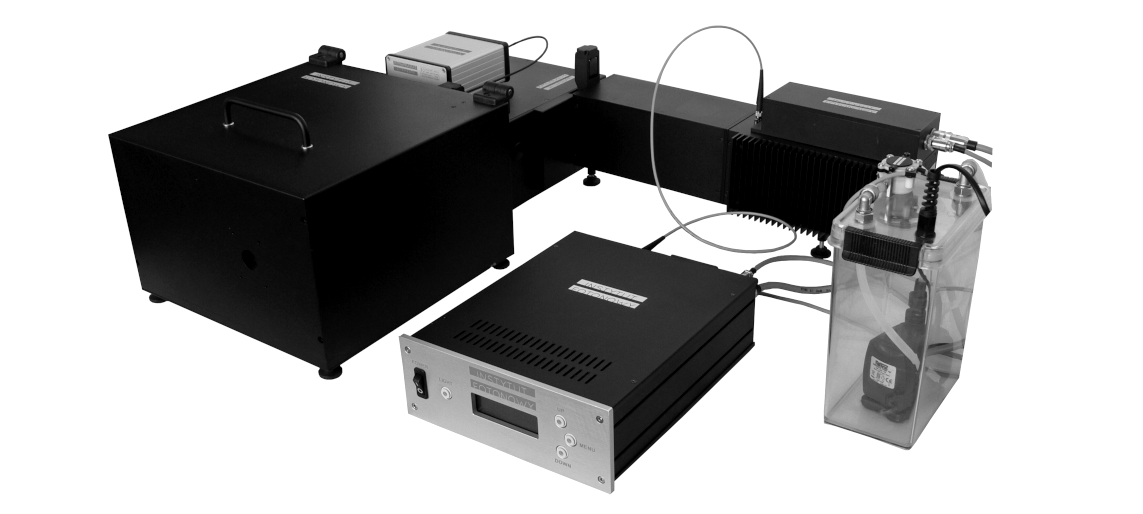
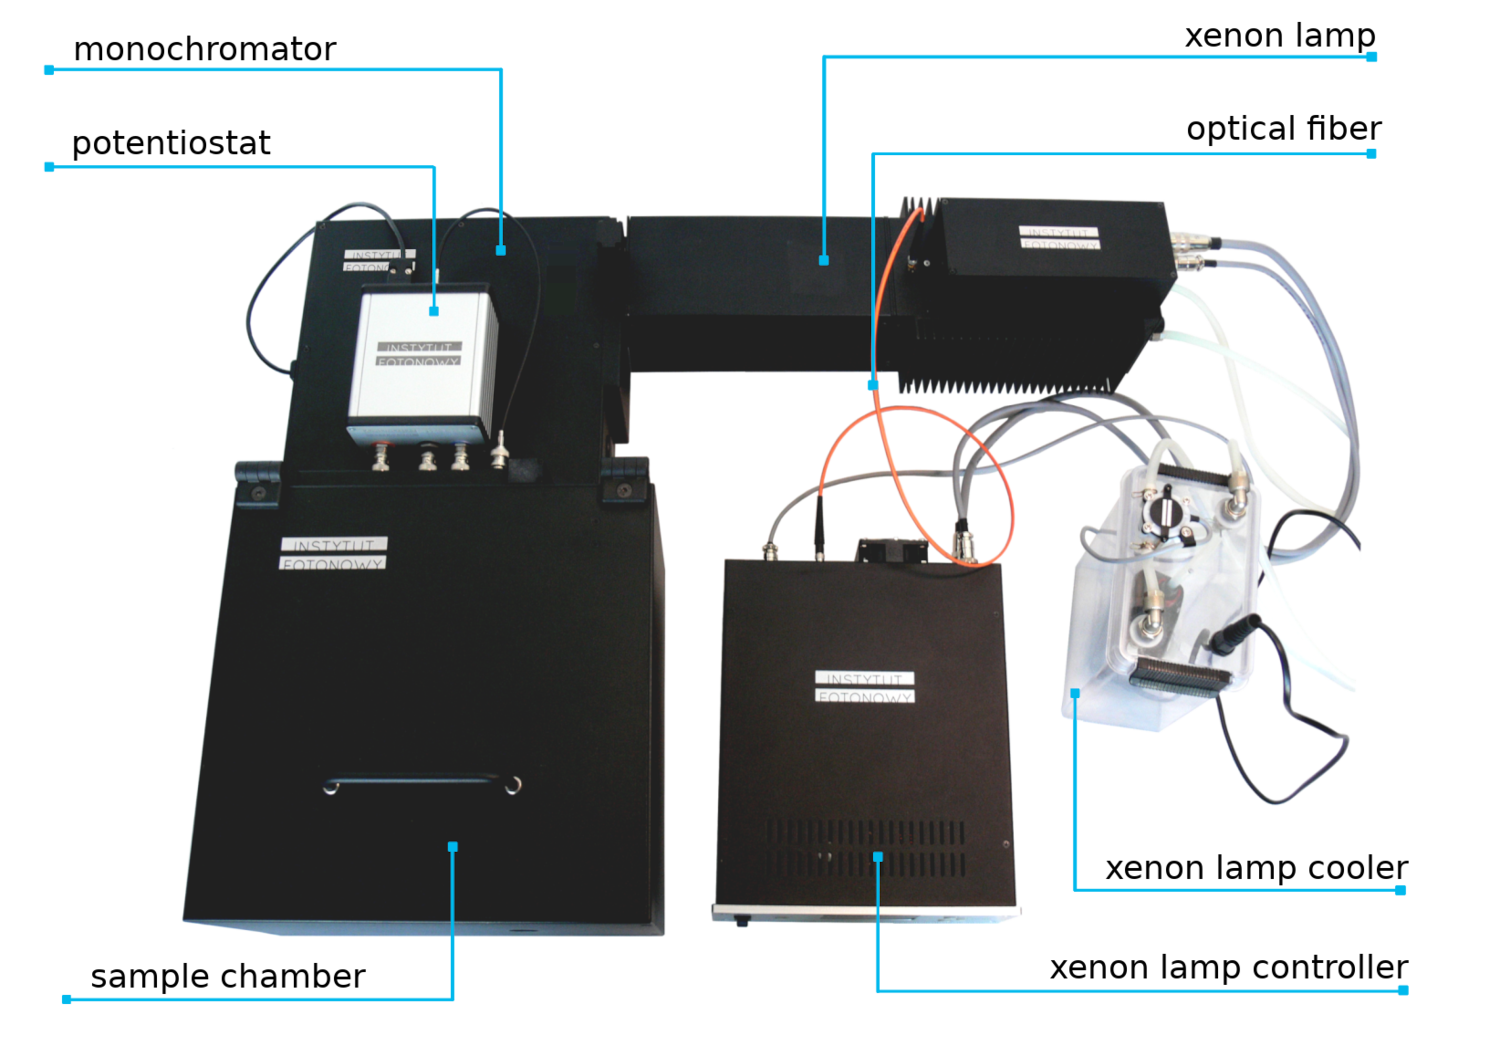
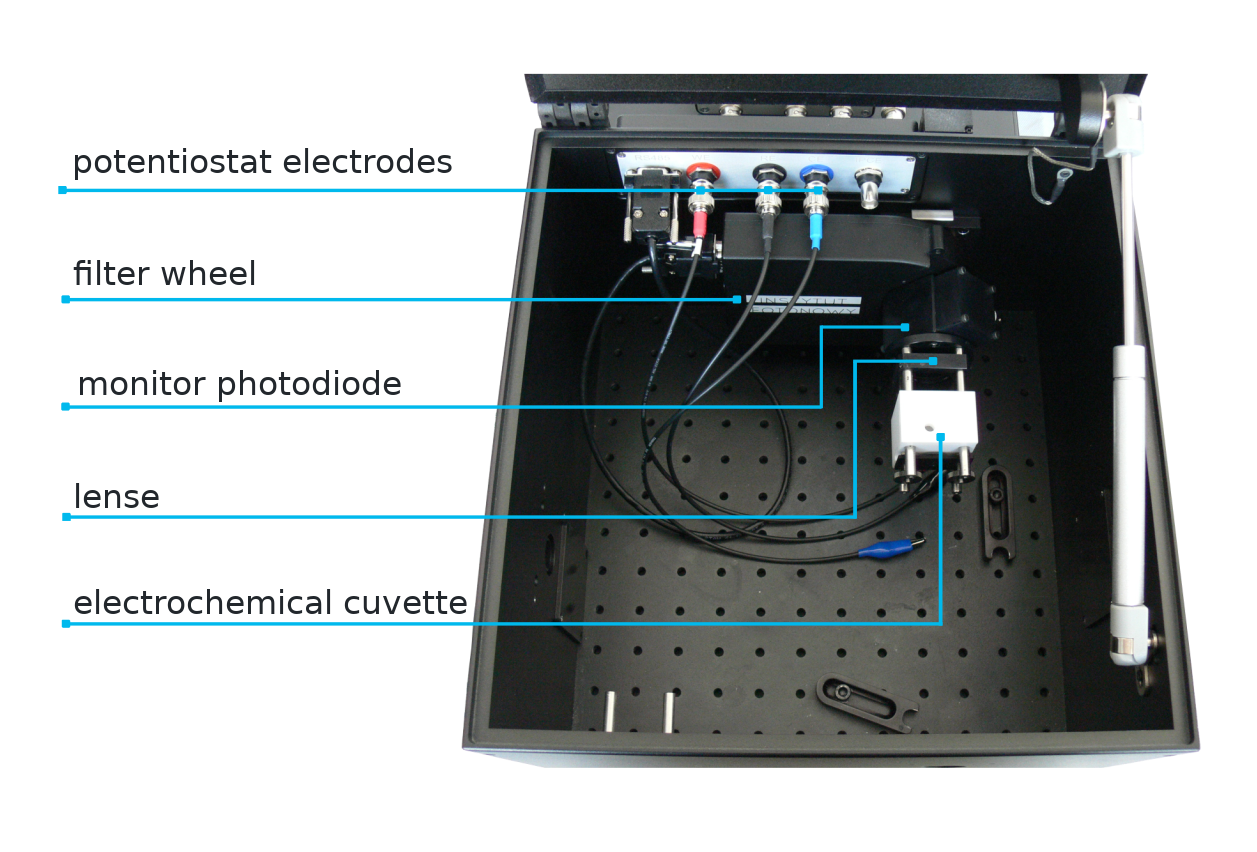
The photoelectric spectrometer serves as a scientific tool to automatically characterize photoelectrical properties (photocurrent, photovoltage) of wide band gap semiconductors illuminated by relatively strong light in UV, VIS and NIR ranges as a function of incident light wavelength.
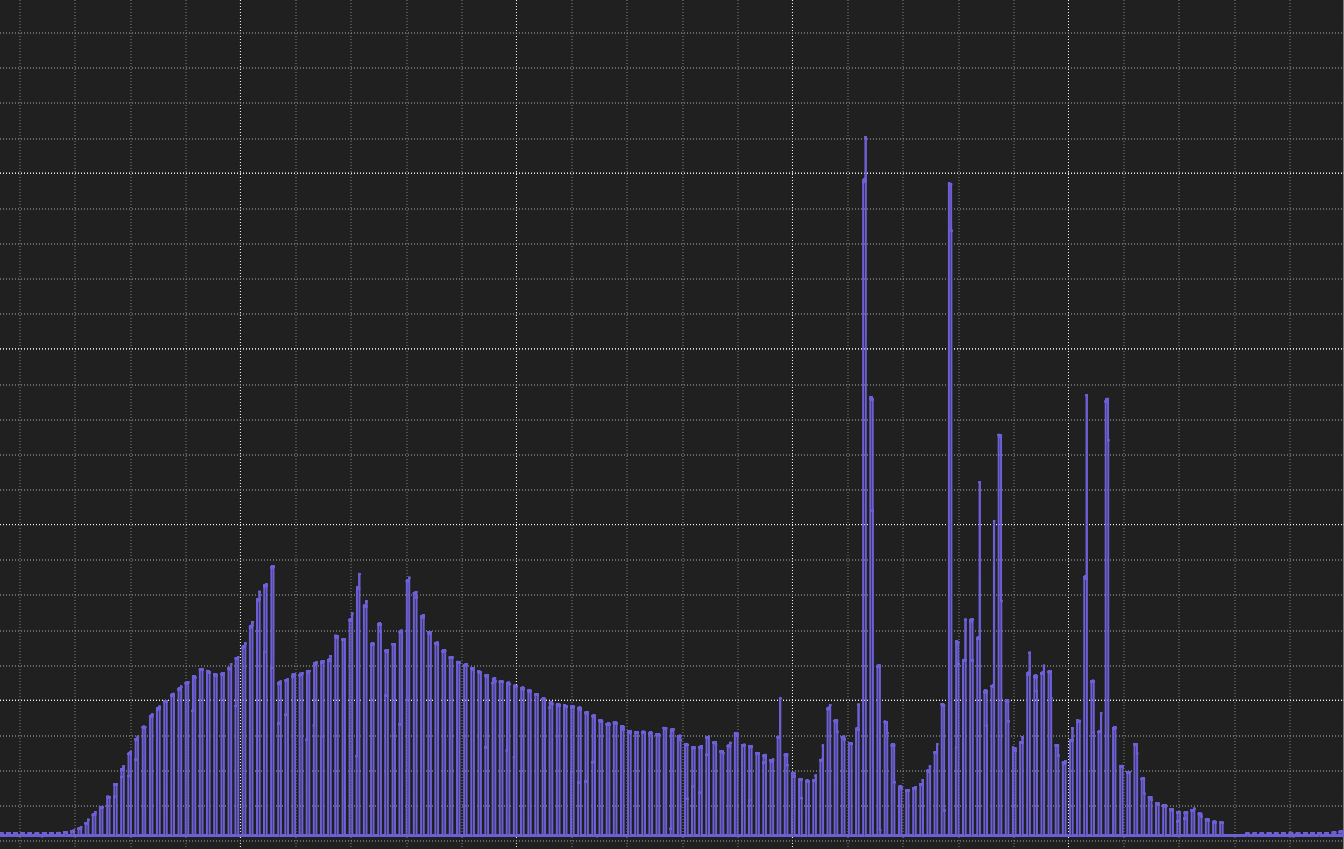
To approximate solar light for many applications we offer Air Mass Filters. These filters modify the spectral output of the arc lamp to mimic natural solar conditions.
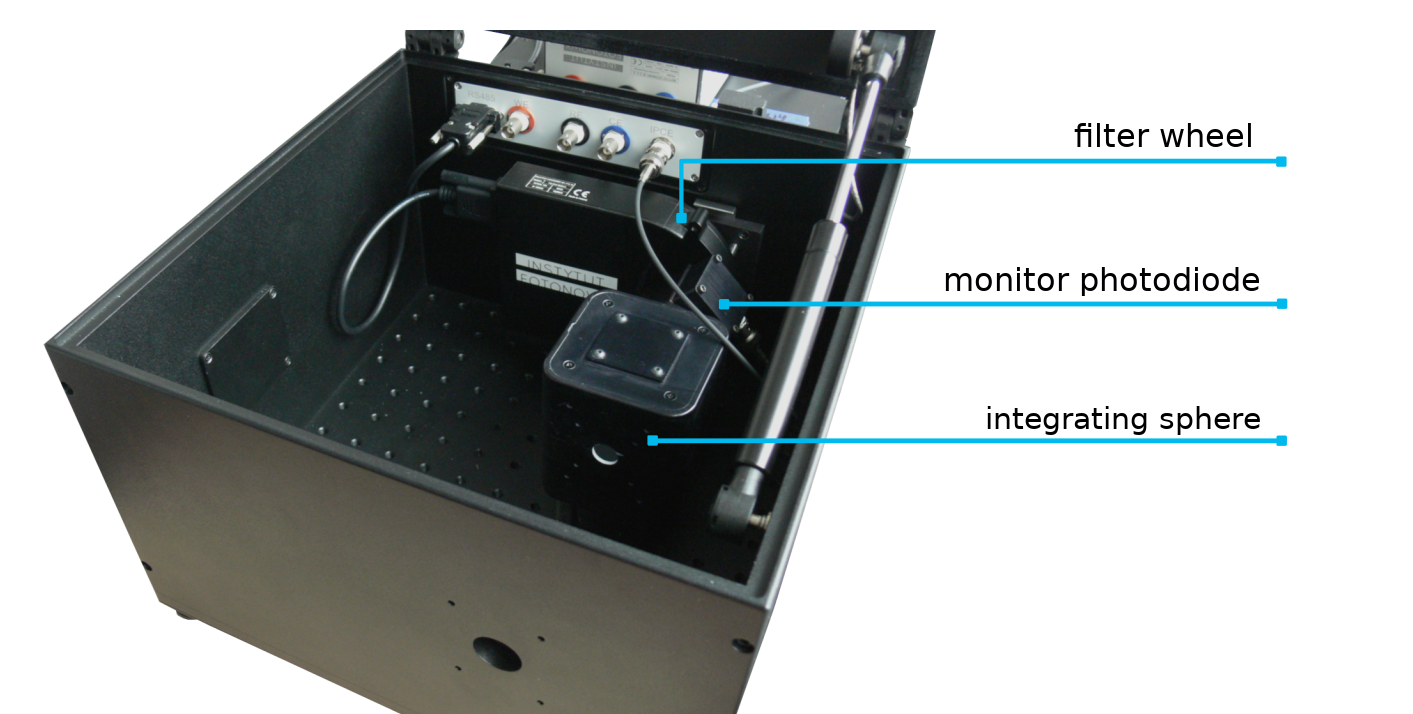
Advanced software of the spectrometer allows for straightforward recording of photocurrent action spectra, photovoltage action spectra along with potentiodynamic and galvanodynamic measurements at constant wavelenght both in CW and pulsed mode. It also provides Incident Photon to Converted Electron (IPCE) ratio and, with integrating sphere, Absorbed Photon to Converted Electron (APCE) ratio as a function of wavelength and bias potential.
Furthermore, the device can be coupled with other detectors, including Kelvin probes, conductivity probes, etc. The devices’ controller takes care of emitted light wavelength, exposition times, proper light edge filters handling and synchronization with a potentiostat.
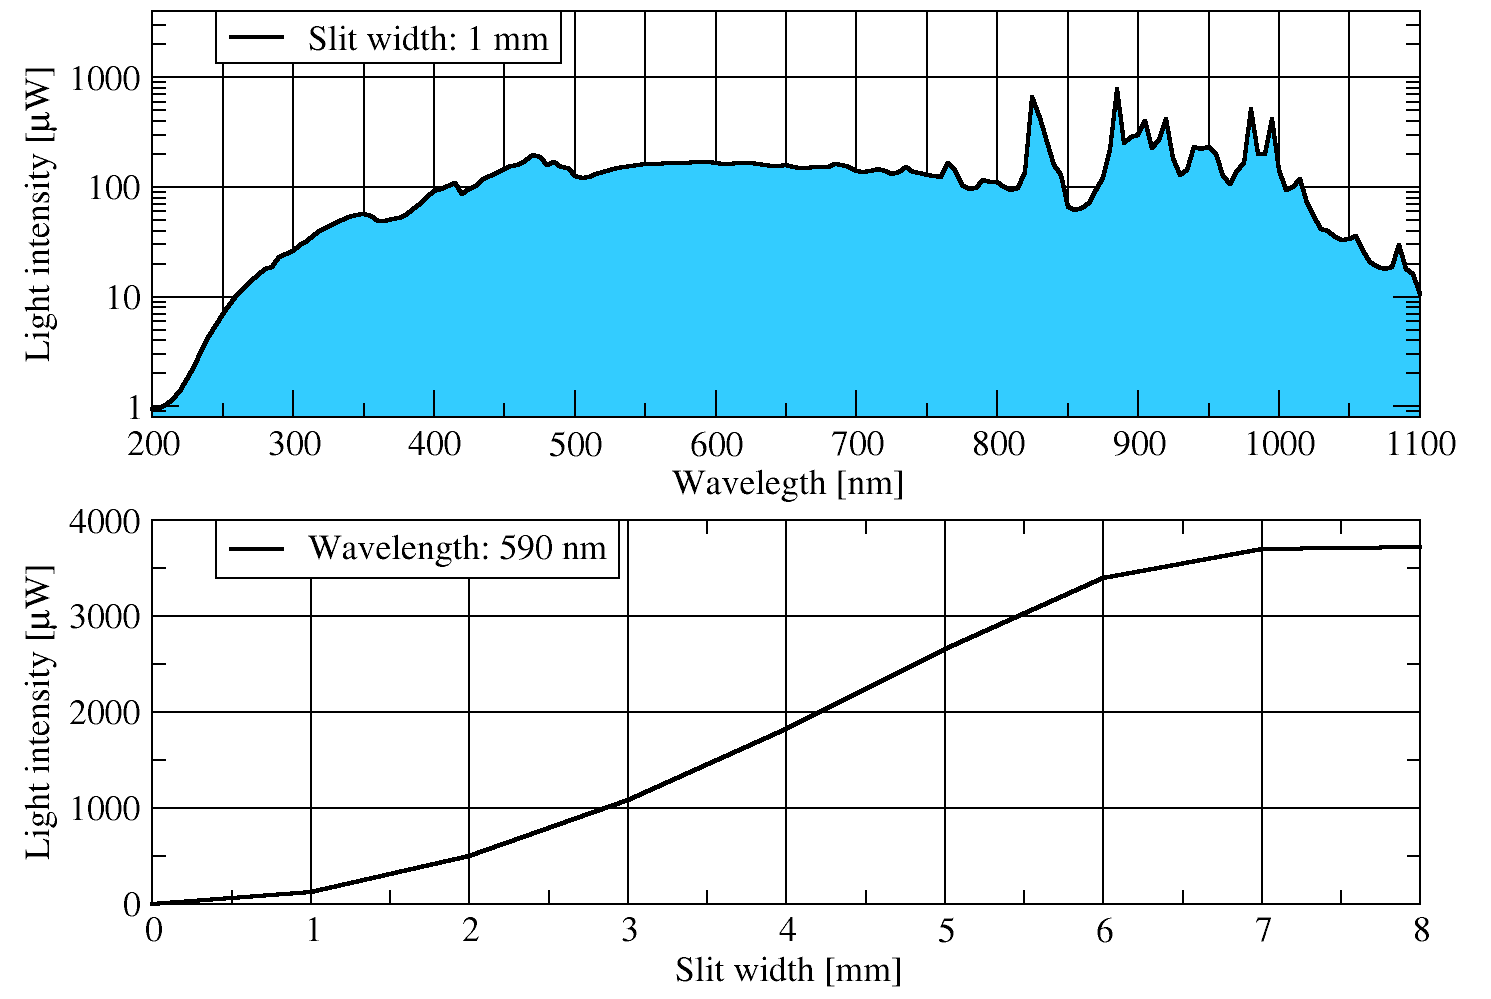
The monochromator is equipped with two switchable gratings to uniformly cover a wide light spectrum. The light power exceeds 10 mW/cm2) in most of the spectral range.
The spectrometer is ready to be connected with peripherial devices like potentiostats, Kelvin probes, synchronous light choppers for lock-in amplified measurements, rotating disk electrodes, electromagnetic valves, LED illuminators, magnetic stirrers, automatic pipettes, temperature controllers, etc.
Many of those peripherials, potentiostats included, can be directly ordered from Instytut Fotonowy.
click the photo to enlarge
The parameters shown beneath are typical for the devices produced so far. All of them can be tailored to specific requirements if necessary.
The light intensity produced by the photoelectric spectrometer varies with the wavelength (top plot) and with slit opening (bottom plot). In the picture, a typical light intensity generated with 150 W xenon lamp and two 1200 gr/mm gratings: optimized for 300 nm and for 500 nm.
click the photo to enlarge
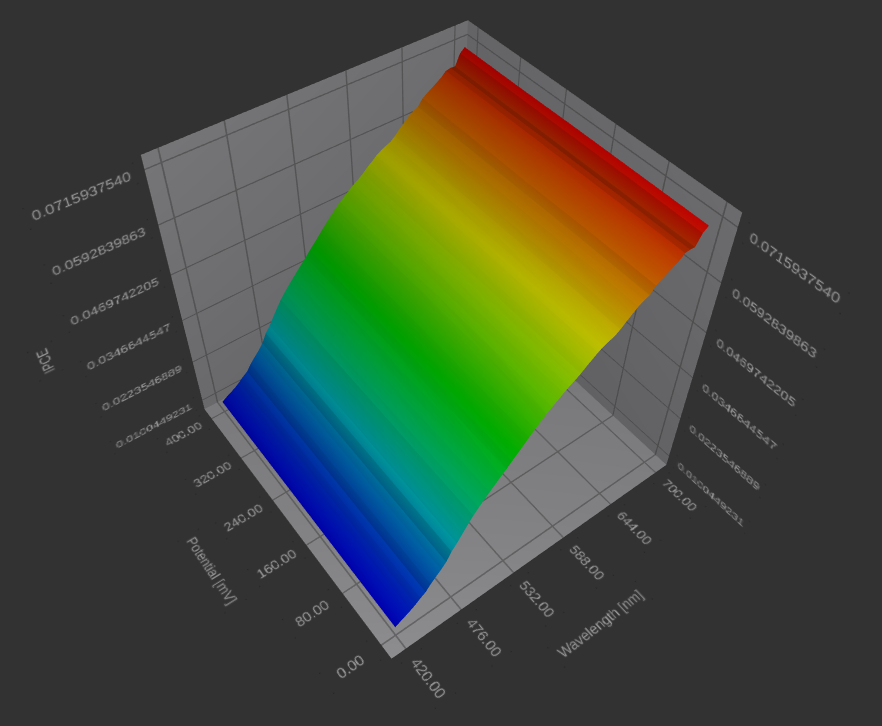
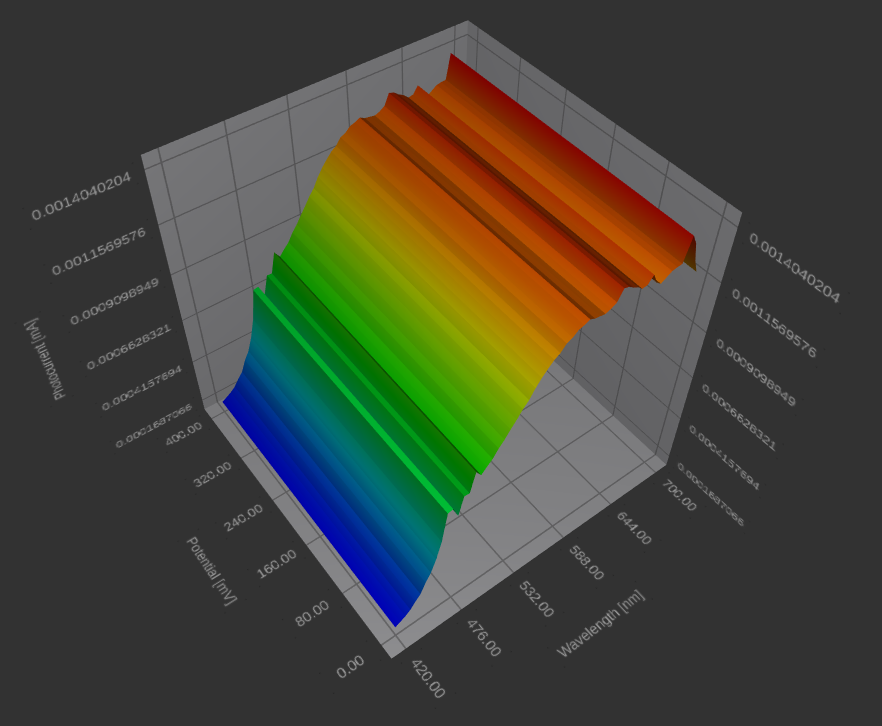
The spectrometer can be used for automatic measurements and visualization of obtained results. At the top, there is a typical photocurrent action map. It is photocurrent values versus light wavelength and applied potential.
The bottom plot contains IPCE map.
In the software, one can switch between the two with a single mouse click.
click the photo to enlarge