


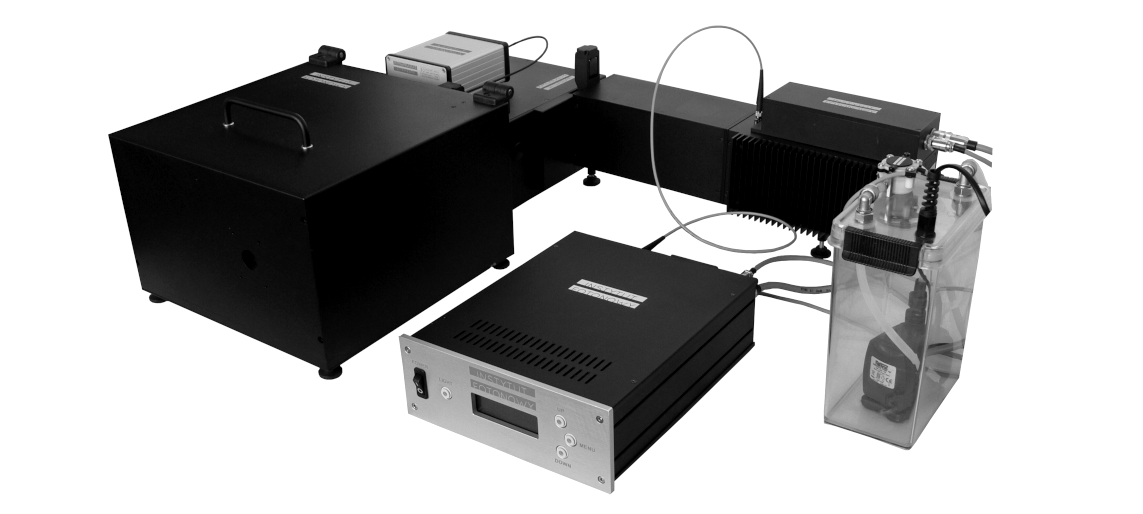
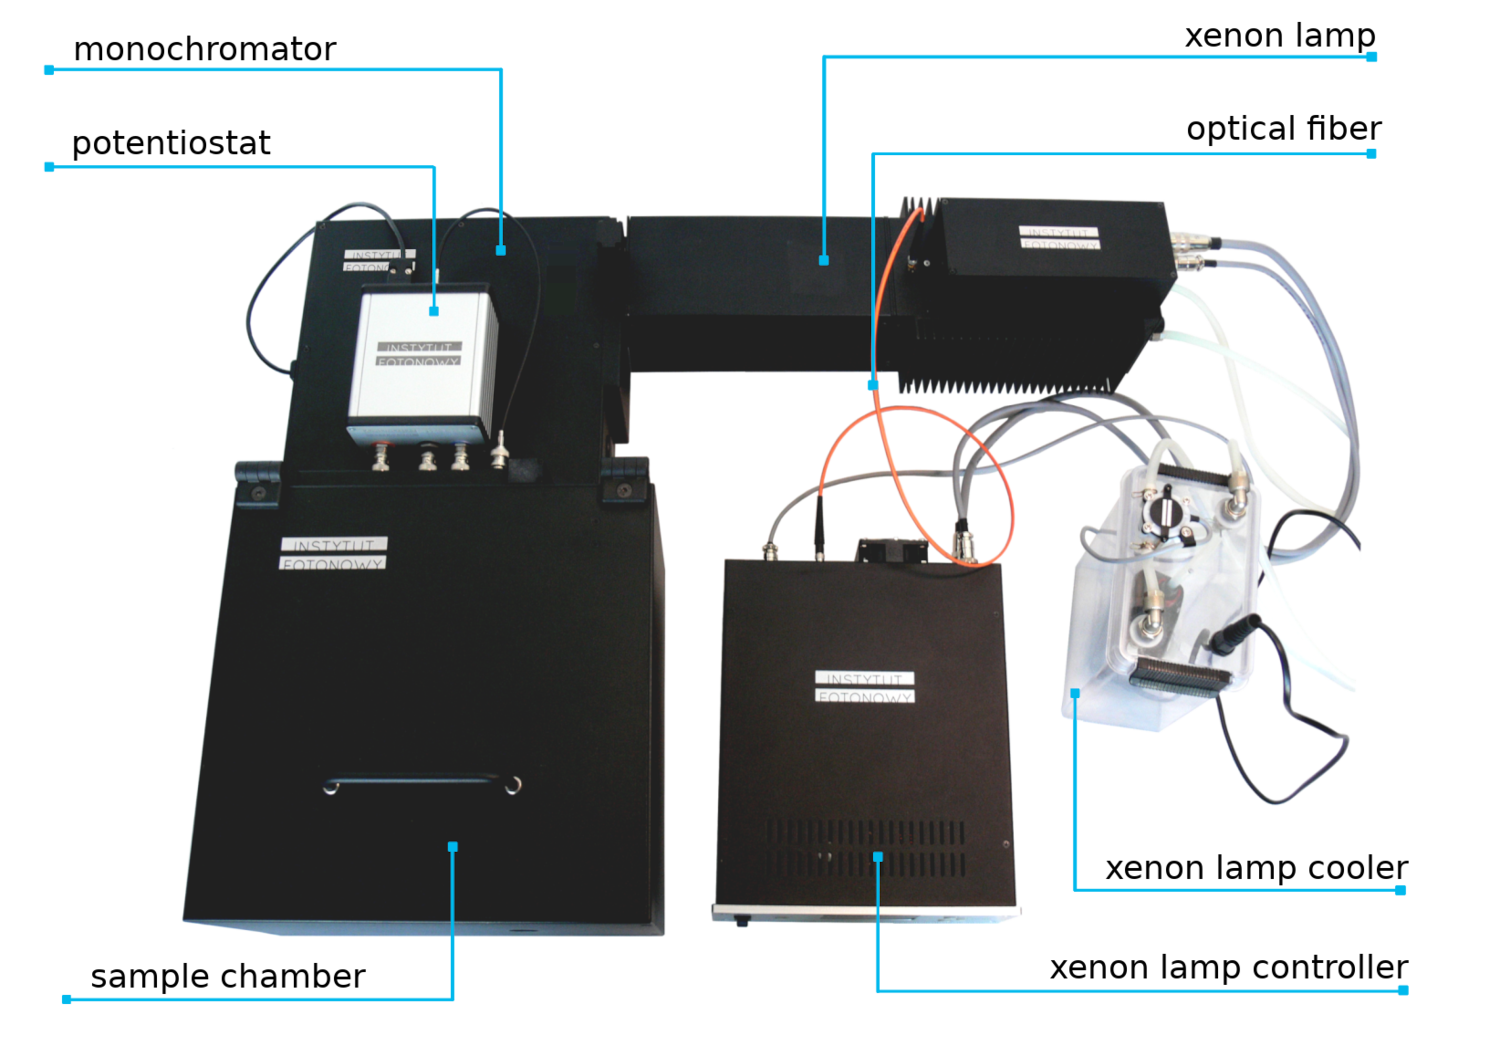
光电光谱仪是一种科学工具,可自动表征宽带隙半导体在相对较强的紫外、可见光和近红外光照射下的光电特性(光电流、光电压)与入射光波长的函数关系。
为了接近太阳光,我们为许多应用提供了空气质量滤波器。这些滤光片可改变弧光灯的光谱输出,以模拟自然太阳光条件。
仪器测量的数量:
- 样品中的电流(时变测量法,CA)
- 开路电位(OCP)
- 样品在白光或单色光照射下的光电流
- 电流-电压特性
- 样品的透光率(带校准器)
- 样品上的光强度(带校准器)
- 开路电位 (OCP) 与光波长的函数关系
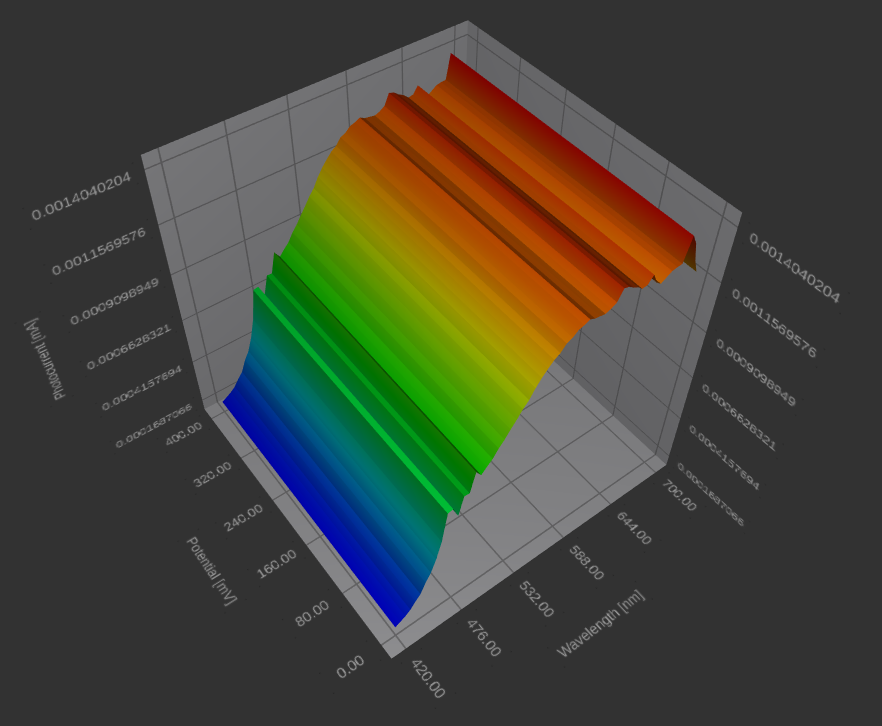
- 作用图(光电流与电位和波长的函数关系)
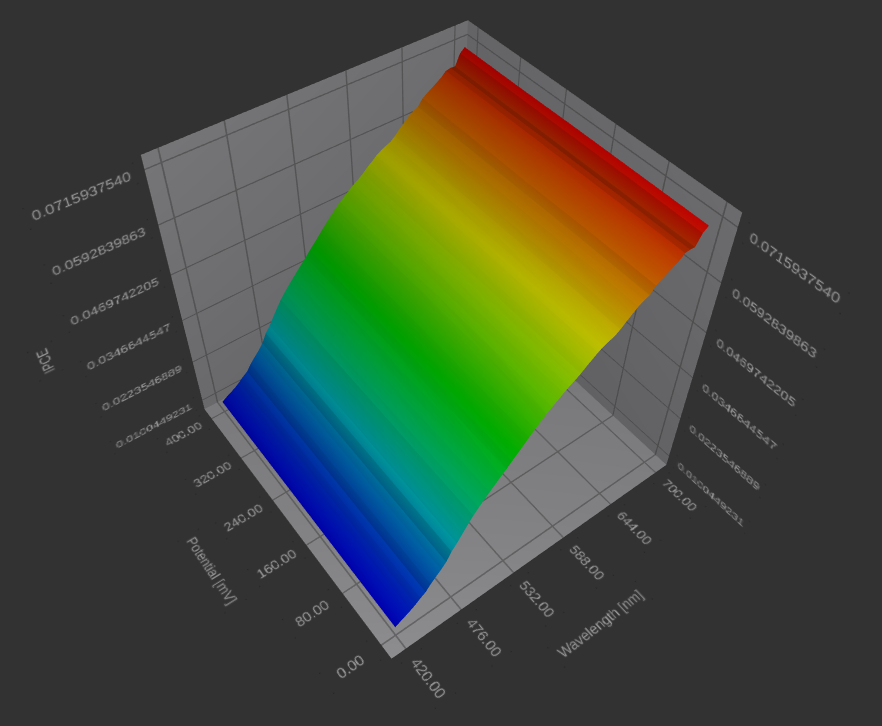
- 作为电位和波长函数的 IPCE 图
- 样品反射率(使用积分球)
- 作为电势和波长函数的 APCE(吸收光子转换电子)图
- 照明下的电流-电压特性
- 样品的功函数(使用开尔文探针)
- 样品在照明下的功函数(使用开尔文探针)
光谱仪的先进软件可直接记录光电流作用光谱、光电压作用光谱以及恒定波长下的电位和电动力测量,包括连续波长和脉冲模式。它还能提供入射光子与转换电子(IPCE)的比率,并通过积分球提供吸收光子与转换电子(APCE)的比率,作为波长和偏置电位的函数。
此外,该设备还可与其他探测器耦合,包括开尔文探头、电导率探头等。该装置的控制器可控制发射光的波长、曝光时间、光边滤光片的正确处理以及与恒电位仪的同步。
单色仪配有两个可切换光栅,可均匀覆盖宽光谱。在大部分光谱范围内,光功率超过 10 mW/cm2)。
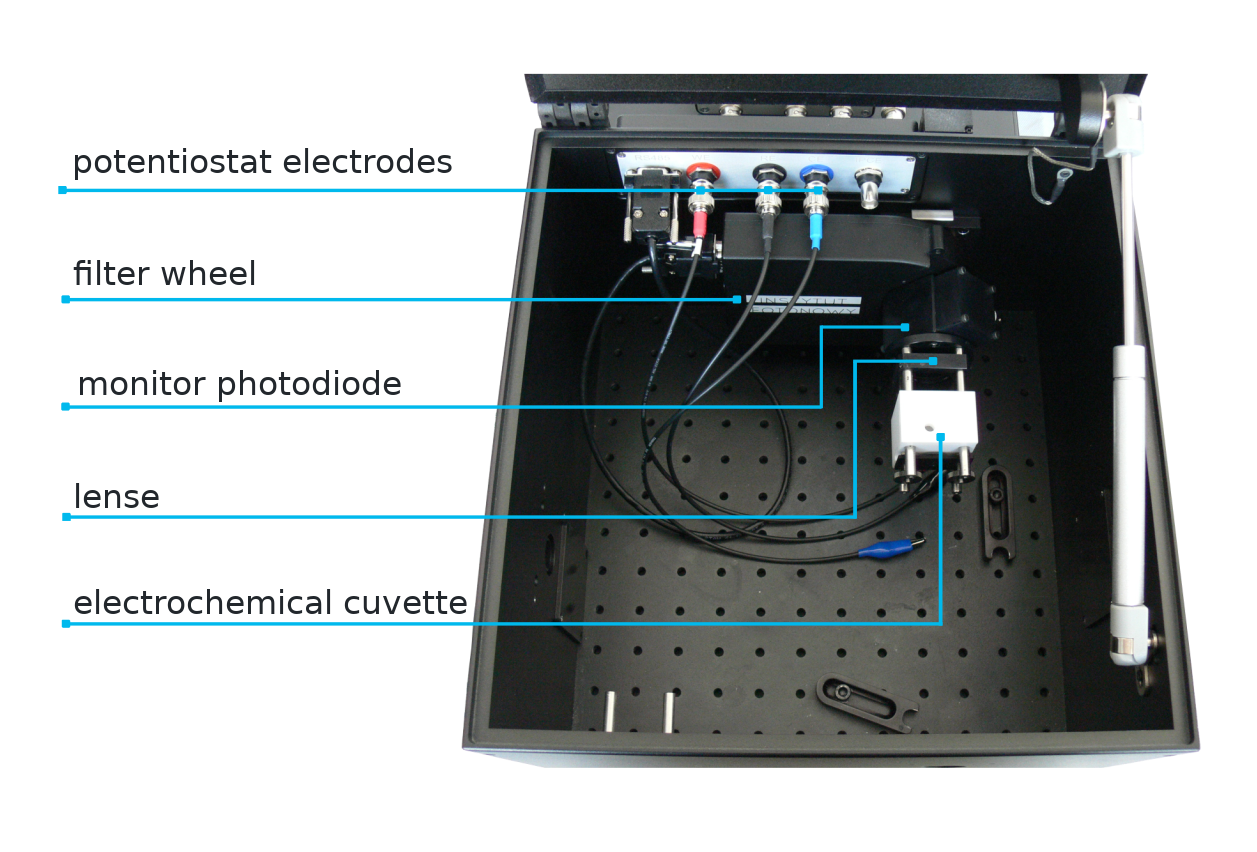
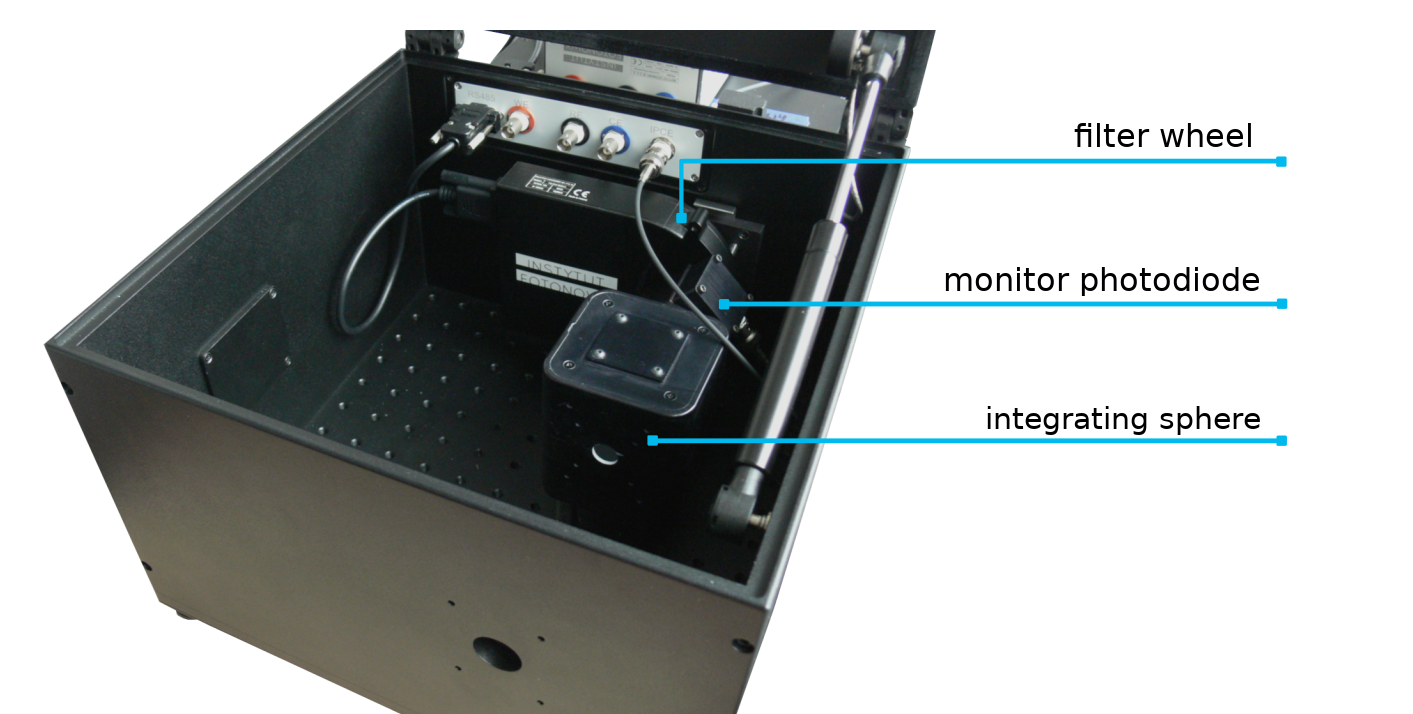
样品室内部
下面显示的参数是迄今为止所生产设备的典型参数。 如有必要,可根据具体要求对所有参数进行定制。
- 光源: Xe 150 W,水冷,带低电磁辐射点火器
- 光稳定模式:电流稳定(畸变 < 1%)、功耗稳定和光强稳定模式,可在实验过程中保持样品照明恒定。
- 最多四个光栅
- 最大光功率密度 35 mW/cm2
附加设备
光电光谱仪可通过与其他仪器连接来扩展其功能,例如开尔文探针、LED 旋转仪、温度控制器等。
- 边缘(长通)滤波器: 400 纳米和 510 纳米
- 最多可配置 6 个滤波器
- 用于与外部设备同步的 I/O 可编程 TTL 线路数量: 16
- 连接性 USB 2.0
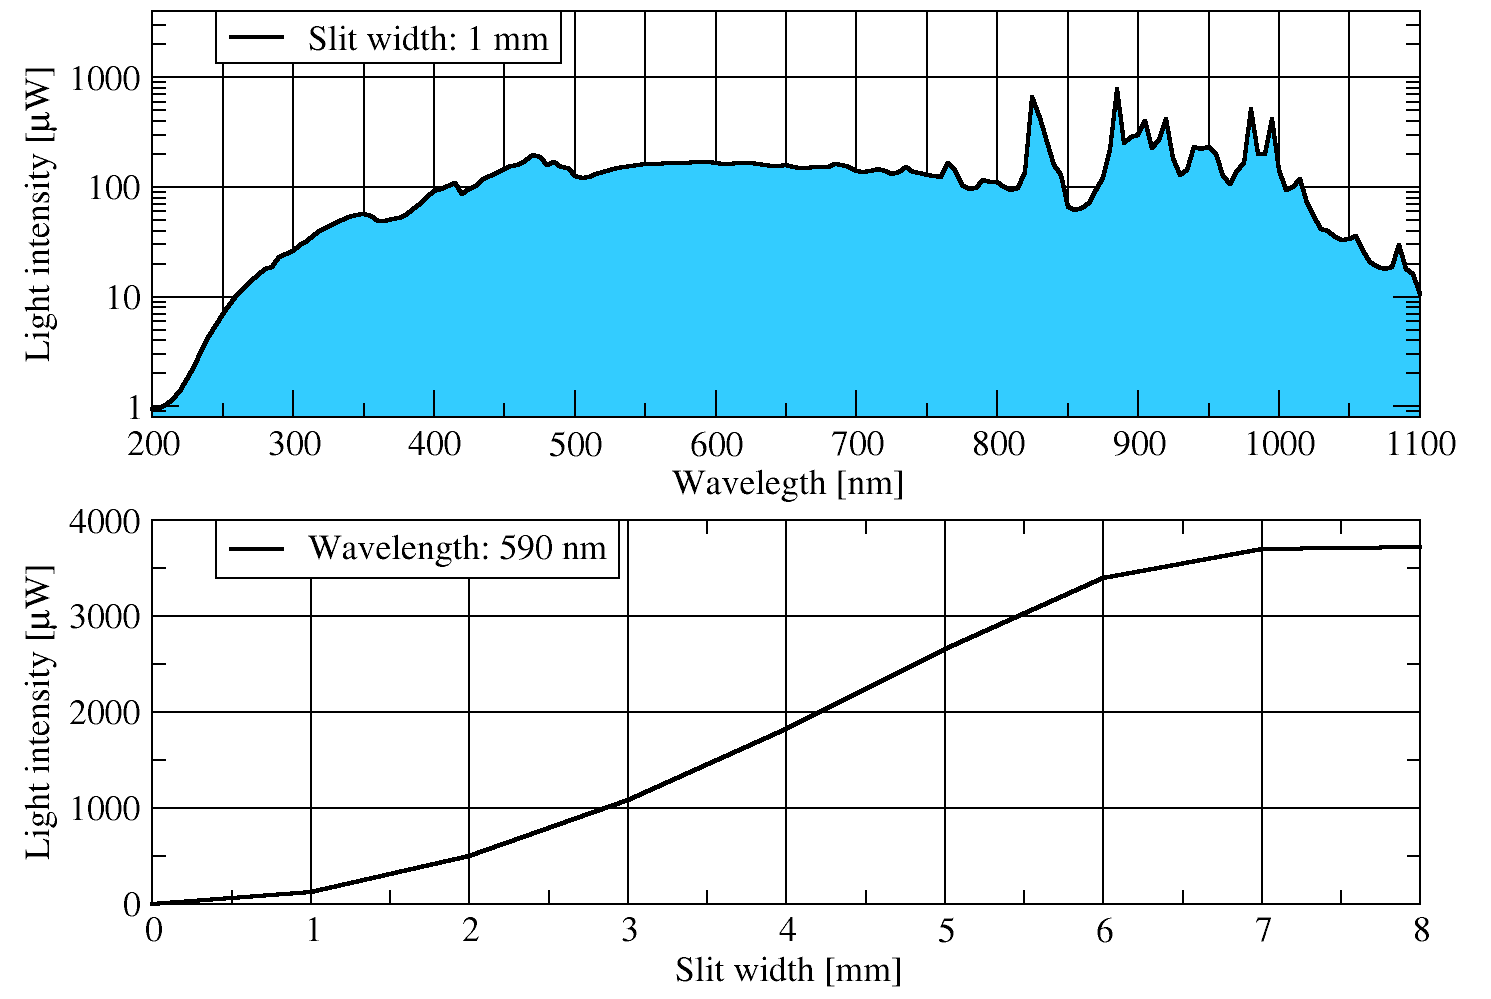
光电分光计的典型光强输出
光电分光计产生的光强随波长(上图)和狭缝开口(下图)的变化而变化。图中是使用 150 W 氙灯和两个 1200 gr/mm 光栅产生的典型光强:分别针对 300 nm 和 500 nm 进行了优化。
点击照片放大
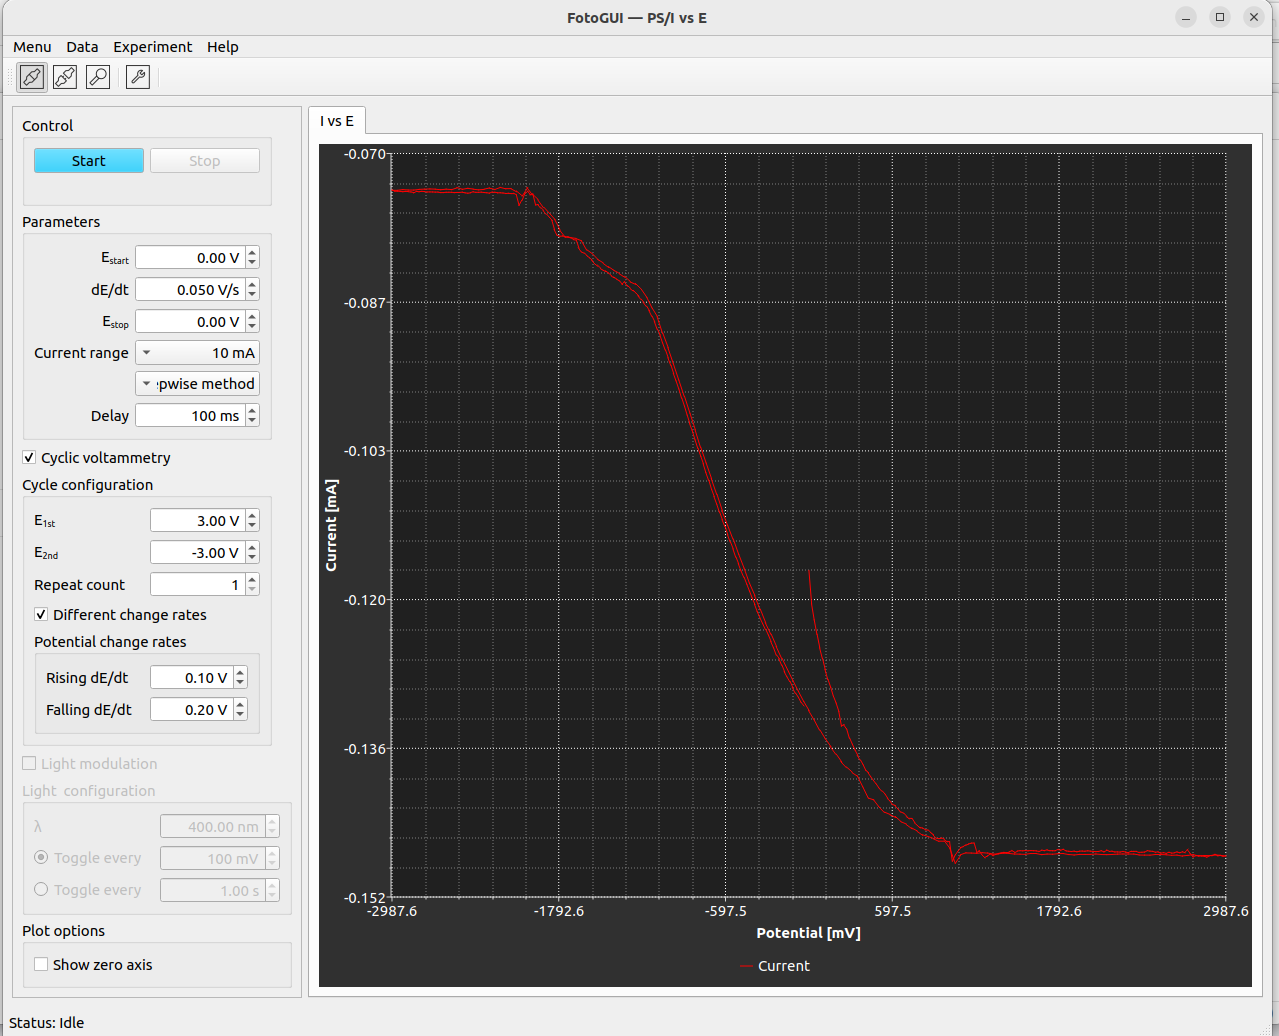
光谱仪可用于自动测量和可视化获得的结果。顶部是典型的光电流作用图。这是光电流值与光波长和外加电位的关系。

PhotoelectricGUI 1.1-42
Zobacz
以下配件与产品兼容