The Impedance Camera is designed for the Time-Resolved Impedance Spectroscopy. Typically, when Impedance Spectroscopy measurements are performed, impedance of a sample is measured subsequently for each frequency applied. However, if a dynamically changing sample is examined, its properties may significantly change during the frequency sweep. A resulted impedance spectrum might be hard to interpret in such a case. The Time-Resolved Impedance Spectroscopy Analyzer takes an entire frequency spectrum with selectable sweep limits in a single shot. All the frequencies are handled at the same time. To observe the time evolution of a sample, many frames may be recorded with a given time interval. The instrument enables to investigate the dynamics of different types of samples, such as electrochemical sensors, materials that changes its properties when exposed to a given agent (light, temperature, catalyst, etc.) and others.
Instrument measures current flowing through the sample and voltage on the sample in response to a voltage signal generated as a superposition of frequencies.
Classic Impedance Spectroscopy (IS) or Electrochemical Impedance Spectroscopy (EIS) assumes that a sample is linear and time invariant (LTI).
However, most electrochemical samples are notoriously both: non-linear and have memory.
Non-linear effects
Thus you can explore the following non-linear effects in your sample:
- Higher harmonics generation,
- Intermodulation (when two input frequencies result in a third frequency at the output),
- Electric current rectification (when resistance/impedance of a sample in one direction differs from the resistance/impedance in the other direction of current flow),
- Superposition breakdown (superposition of input frequencies is not preserved in the output).
Sample memory effects
- Time evolution of impedance spectra of a sample under stable ambient conditions reveals if previous measurements affect the next.
Presentations of results
The measurement results are presented in:
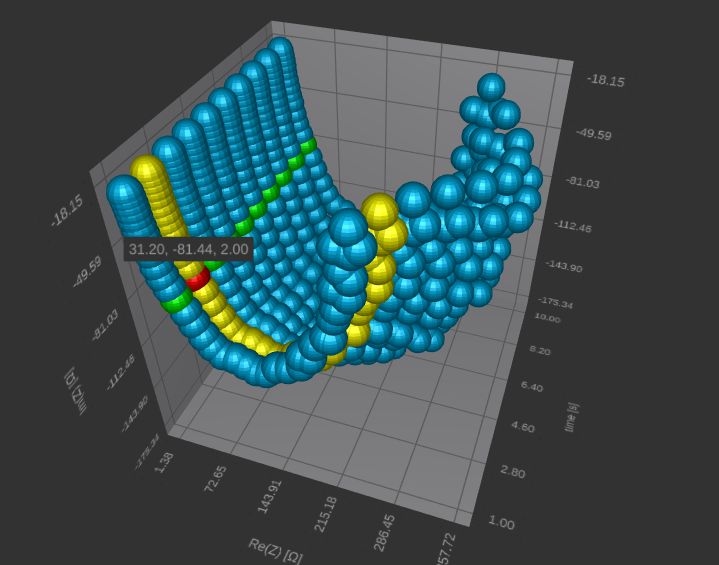
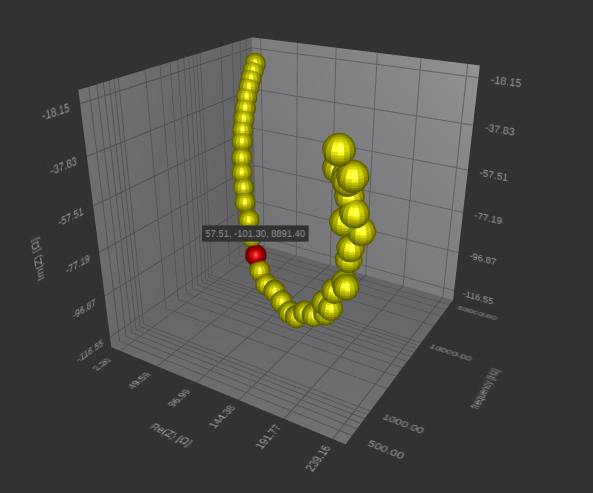
- 3D Nyquist (Argand) plot in time,
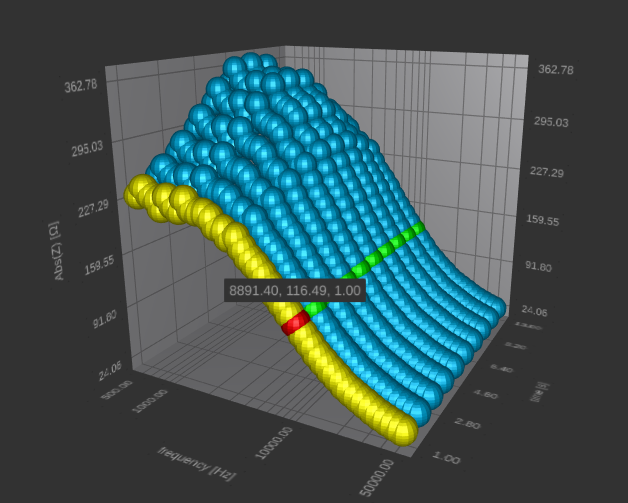
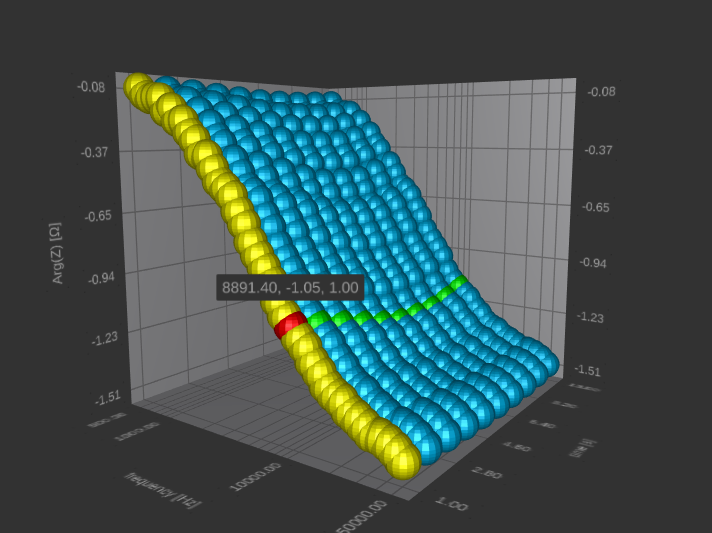
- Bode plots in time,
- Time evolution plot of an impedance at a given frequency contained in generated signal,
- Difference plots to observe relative changes in time,
- Plots with raw current and raw voltage frames collected.
The Time-Resolved Impedance Spectroscopy Analyzer is ideal to observe the real time development of impedance of electrochemical sensors. This type of measurements is complementary to static photocurrent/photovoltage measurements performed, for example, with Photoelectrochemical (PEC) Measurement Station:.
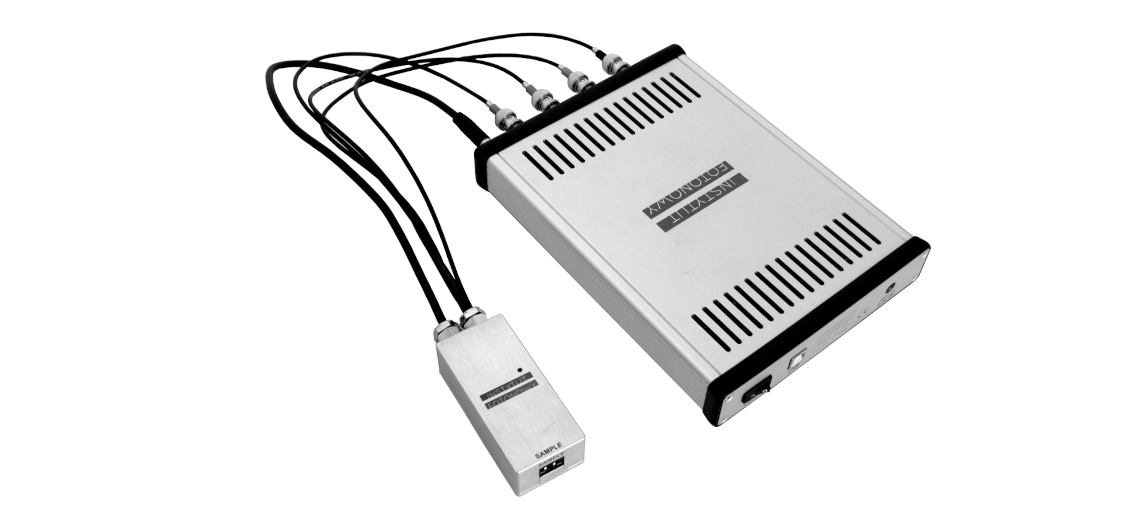
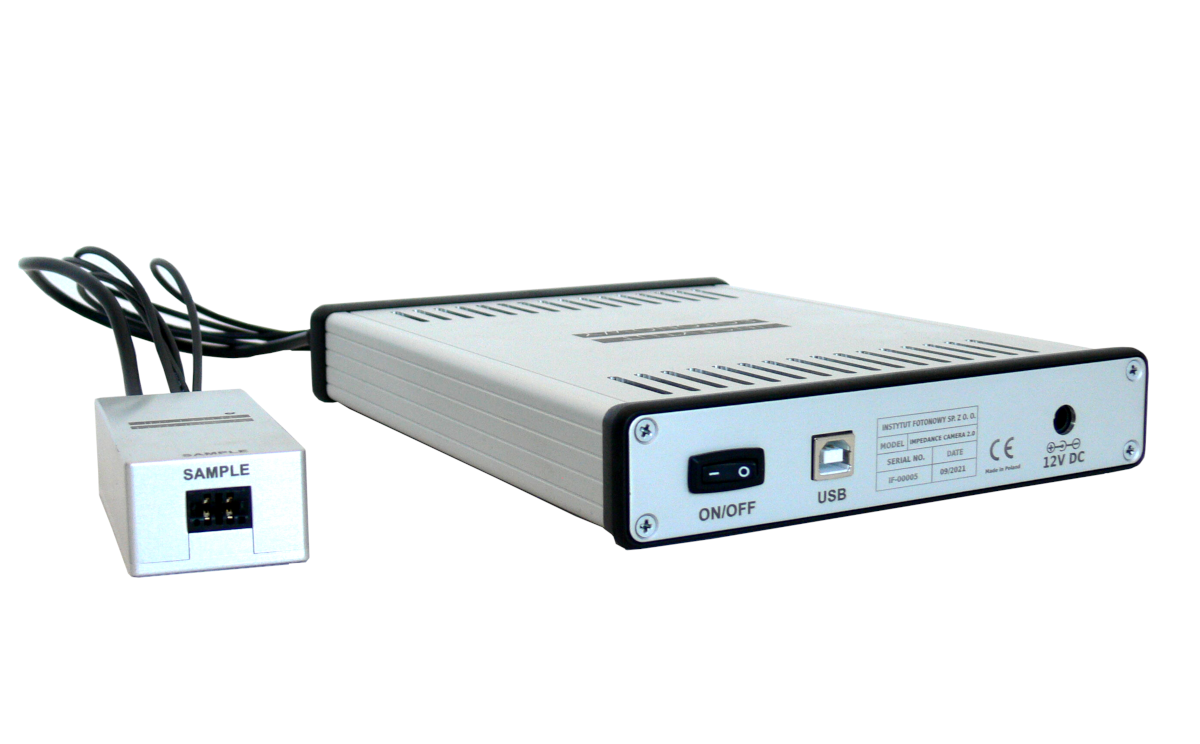
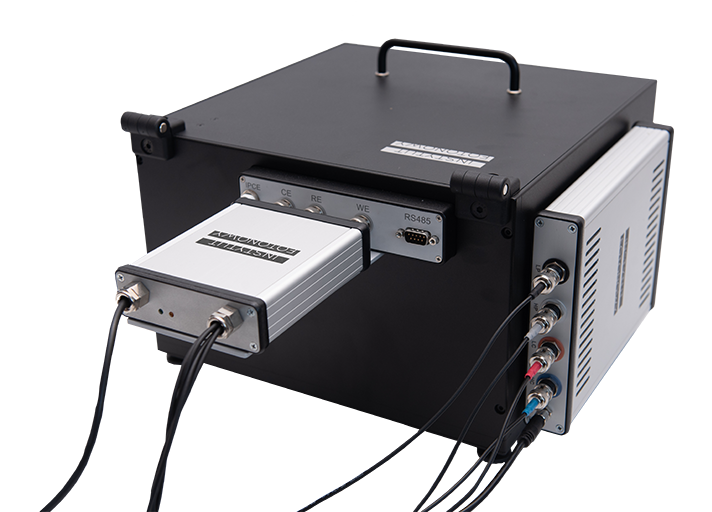
The instrument consists of:
- Measurement electronics module
- Measurement head: Basic/Electrochemical,
- 12 V power supply,
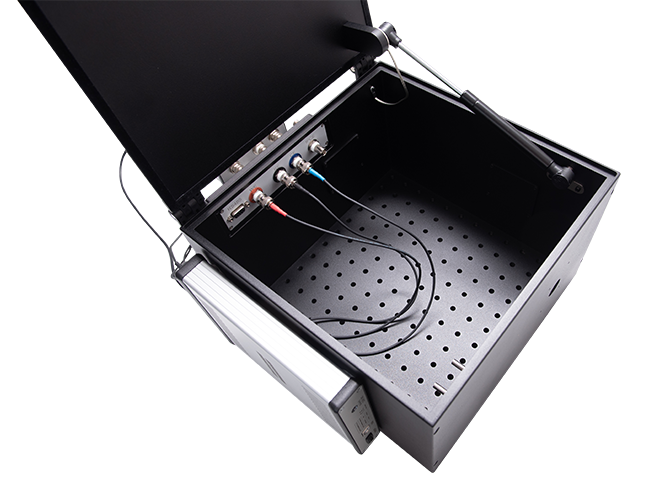
Time-Resolved Impedance Spectroscopy Analyzer for electrochemical measurements
Time-Resolved Impedance Spectroscopy Analyzer combined with the Electrochemical Head and the Electrochemical Shielding Box serves as a measurement setup dedicated for the electrochemical samples that needs to be screened from the ambient light and external EM fields.
kliknij obrazek, aby powiększyć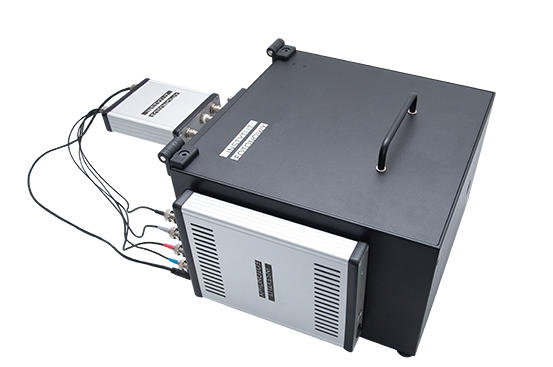
Time-Resolved Impedance Spectroscopy Analyzer
- Number of frames in a sequence: unlimited,
- Number of frequencies in a frame: unlimited,
- Range of generated potential signal: -1 ÷ 1 V,
- Measurement Head types: Basic (Two-Electrode)/Electrochemical (Three-Electrodes),
- Sampling rates: 1.22 kHz ÷ 10 MHz,
Basic Head
- Current ranges: 10 mA, 1 mA,
- Frequency ranges: 1 mHz ÷ 1 MHz,
Electrochemical Head
- Current ranges: 1 mA, 100 μA, 10 μA, 1 μA, 100 nA, 10 nA,
- Bandwidth ranges: 2.5 MHz, 1.3 MHz, 300 kHz, 35 kHz, 3kHz, 300 Hz,
The measurement results shown below are obtained for a parallel RC circuit where the resistance was depends on the oscillating illumination intensity.
Nyquist (or Argand) plot presents a real and imaginary part of impedance measured for range of frequencies at various times. One can see the impedance value increases in the middle of the measuring sequence and the impedance semicircles grow in the diameter.
The green color selects the same frequency measurement points in time. If only capacitance was changed, in the RC circuit, all semicircles would be the same size but position of given frequency points would move along a circle.
Click to enlarge